How the Housebook Comparative Table Works

Speed, visibility, and convenience are essential in international real estate sales. The Housebook Cyprus platform offers a tool that combines all these advantages.
What does the Comparison Chart do
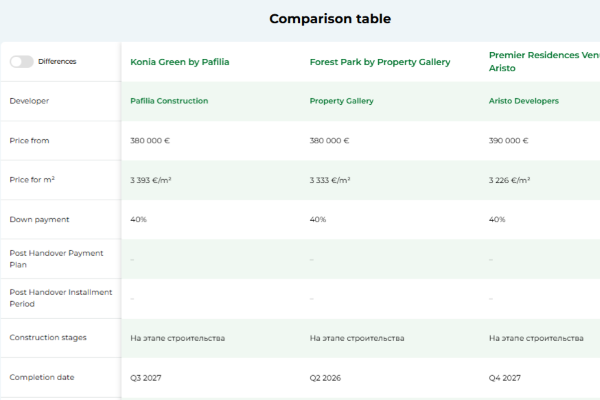
The Comparison Chart is a visual overview of the key features of all projects included in the presentation.
It automatically collects and displays key information—location, property type, number of bedrooms, square footage, completion date, and price—in a single, structured view.
Instead of browsing through dozens of pages, the agent and client can compare all options on a single screen, significantly simplifying the selection process and making the consultation process faster and more transparent.
Key Advantages for Agents
· Saves time: No need to prepare manual comparison charts — the system does it instantly.
· Enhances professionalism: Every client receives a clear, structured presentation showing your attention to detail.
· Builds trust: Clients appreciate transparency when they can directly see project differences in one document.
· Improves conversion: With projects presented visually and logically, it’s easier for clients to choose and for agents to close.
Built-In Smart Tools
The Comparative Table can be used interactively — you can highlight specific rows, add personal comments, or update prices and delivery stages as projects evolve.
Combined with Housebook shareable presentation links, this tool becomes a powerful communication asset for international collaboration between agents, developers, and clients.


